Learn more about the "Bio," "At a Glance," "Motions," "Outcomes," and "Milestones" Tabs.
Judge Analytics - Overview - Watch Video

Table of Contents
- Contents of the "Bio" Tab
- Contents of the "At a Glance" Tab
- Contents of the "Motions" Tab
- Contents of the "Outcomes" Tab
- Contents of the "Milestones" Tab
💡 We strongly recommend that after viewing a Judge Analytics Dashboard, you then use Smart Search to further research the judge’s rulings and orders in cases with legal issues that are similar to yours, thus drilling down on the “why” of your judge’s metrics. Analytics plus context are the key to gaining a strategic advantage, facts matter!
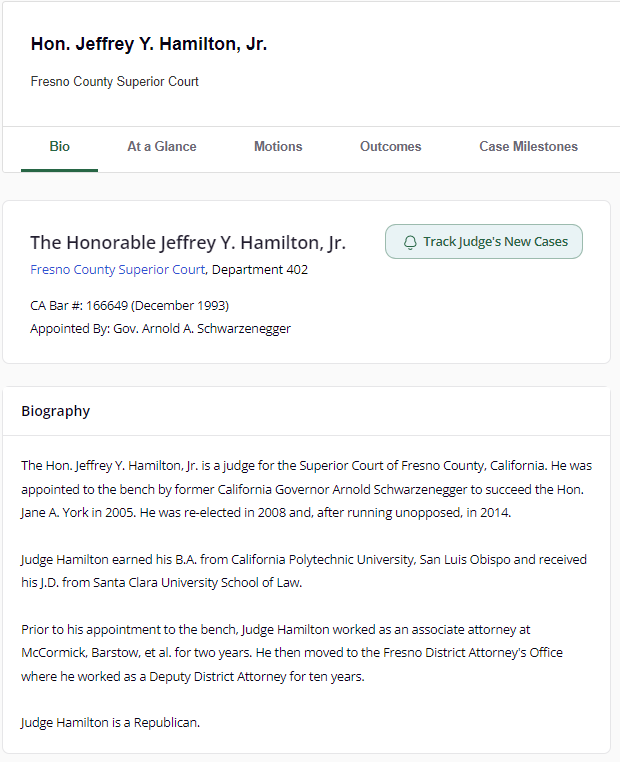
Contents of the "Bio" Tab
This page contains all of the subjective information on a judge, including career history, political affiliation, articles by and about the judge, as well as practical information on the right hand column such as the court clerk’s phone number, rules that are applicable in the courtroom, etc. Learn more about how we craft our judge biographies.
Contents of the "At a Glance" Tab
For hard data on your judge, first start with At a Glance. This page has a zoomed-out view of your judge and contains important high-level metrics. For every metric, Trellis will always give you the county average and the state average so you can see where the judge is an outlier in comparison to other judges. These metrics include:
- Active Cases: The number of active cases your judge has on their docket.
- Average Case Length: How long a case sits before your judge on average, from the date the case was filed to the first dismissal order.
- Motion Grant Rate: This metric is a zoomed-out view across all motion types and all case types, displaying how your judge tends to rank in terms of leniency or aggressiveness in granting motions compared to other judges.
- Verdict breakdown: This metric is specific to bench trials. For jury trial data relating to your judge, use the Verdicts tab on Smart Search.
- Case Practice Area breakdown: Lower on the screen is the judge’s overall case calendar (i.e., the types of cases this judge hears) broken down by percentage in pie charts based on practice area and matter type. Here, you can get an understanding of how familiar your judge is with particular matter types, and help you assess whether you should be focused on educating the judge from the very start of the case.
The larger “pie” includes broader Practice Areas, and clicking on any Practice Area will show you a smaller pie with Matter Type metrics:


Contents of the "Motions" Tab
This tab contains all of the granular motion-by-motion analysis for your judge, broken down by motion type. Important pre-trial motions will be on the left-hand side:
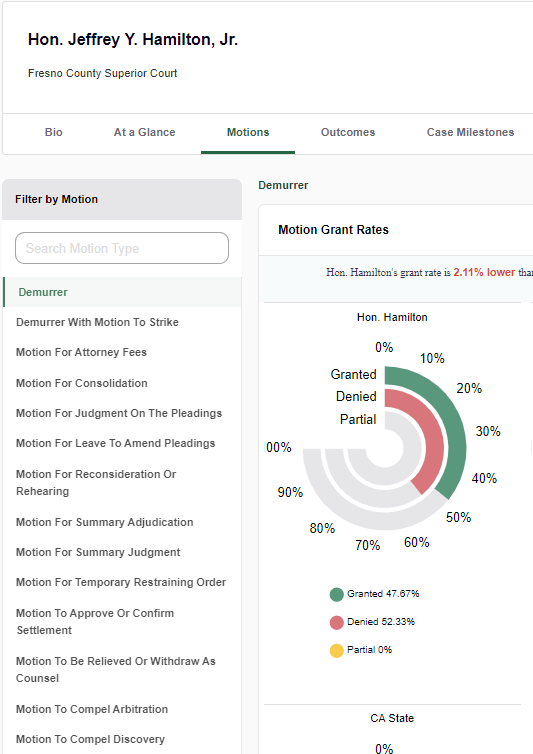
To the right, you’ll find motion grant rates and denial rates for your judge. You’ll see your judge’s metrics as compared to other judges in the county and state. Your judge’s grant rates will always be listed first, then the county average, then the state average, giving you context as to where your judge ranks in comparison to other judges.
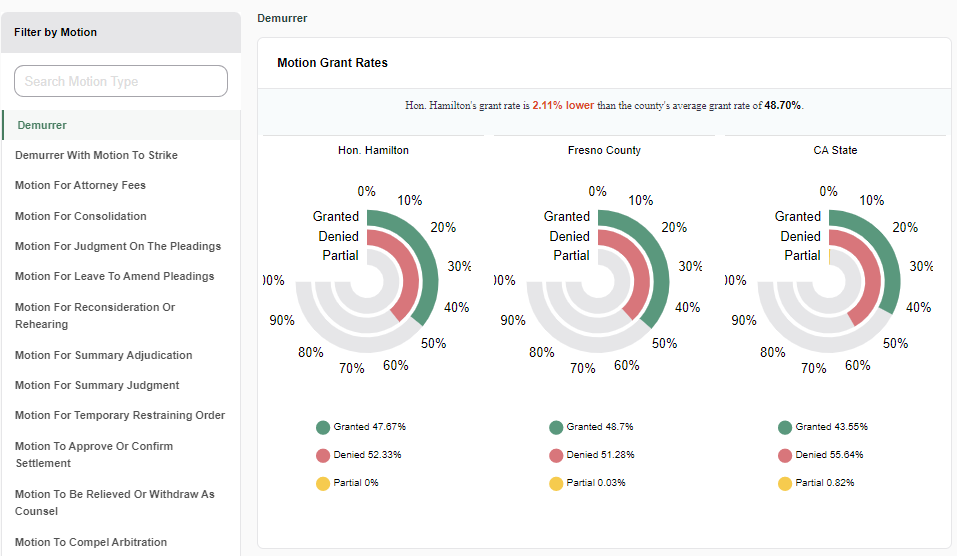
🔎 If the motion type you’re looking for isn’t listed here, that means we don’t have enough statistically significant data on that motion type. We acquire new data on a daily basis. Rather than display metrics that may not be accurate due to small sample size, we’ll only show you metrics where there is sufficient data.
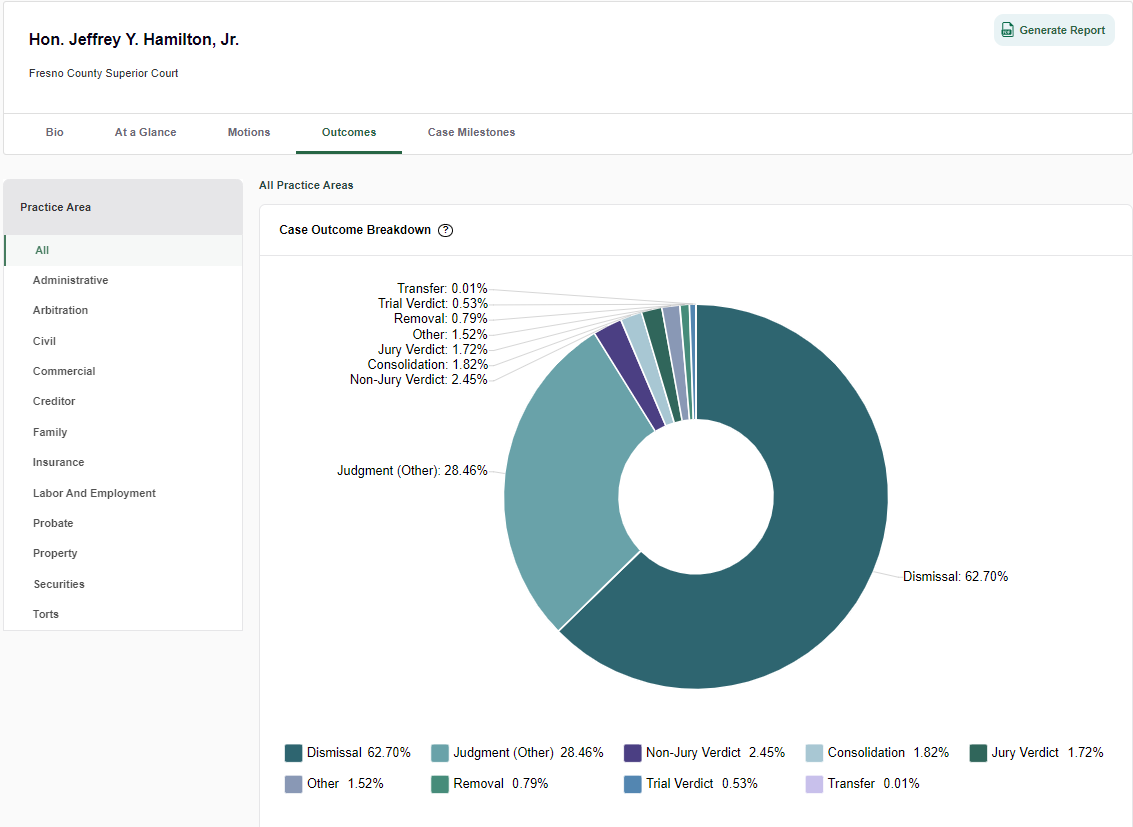
Contents of the "Outcomes" Tab
This tab will display case outcome metrics, i.e., data on how cases are getting disposed of before this judge. You’ll find information on how often cases before your judge are going to jury verdict, getting removed to federal court, consolidated with other cases, etc.
If you don’t select a specific practice area on the left hand column, you’ll be viewing outcomes across all case types for your judge:
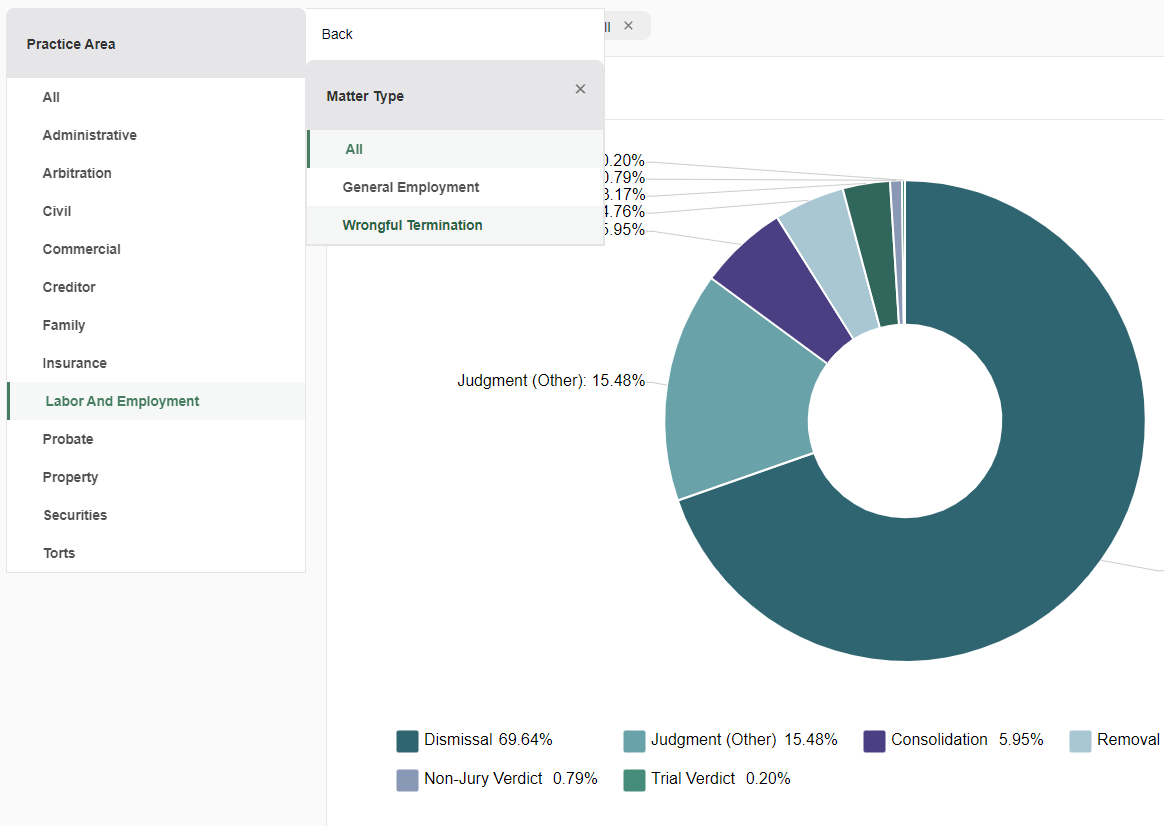
If you select a practice area, you can then filter further by matter type to see even more granular metrics:
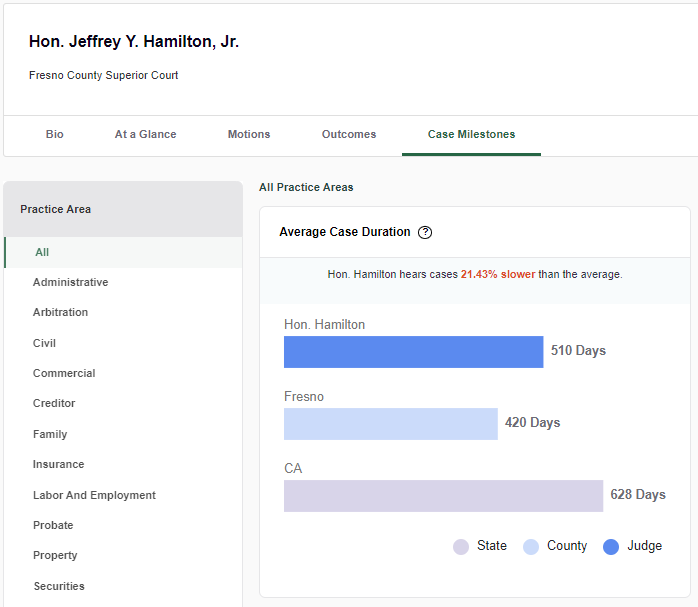
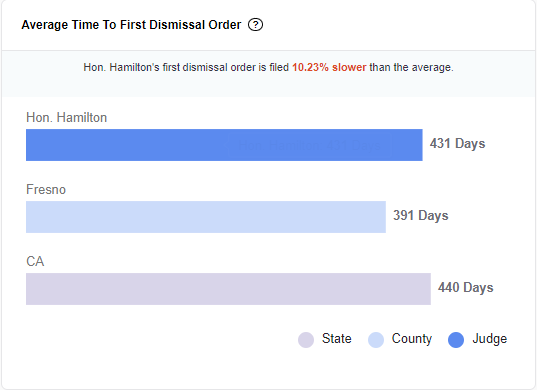
Contents of the "Milestones" Tab
This tab will display timing analyses for your judge, such as average case duration, average time to trial, etc. You can also drill down by practice area and matter type. These metrics include:
- Average Case Duration: This shows how many days a case will sit before your judge on average, as compared to other judges in the county and state. This metric is calculated regardless of outcome, i.e., regardless of whether the case settles or goes all the way to trial.
- Average Time to Trial: This metric shows the average time it takes for cases to go all the way to trial before the judge.
- Average Time to First Dismissal Order: This metric really pertains to settlement. We track to when the judge issues their first dismissal order in a case, which is often a close proxy to settlement.